Assignment 2 : Big data storage
Course: Big Data - IU S25
Author: Firas Jolha
Due at: March 3, 23:59
Agenda
- Assignment 2 : Big data storage
- Agenda
- Dataset
- Submission link to Moodle
- Tools/Language to use
- Objectives
- Background
- Dataset Description
- Data Modeling and Storage Tasks (35 points)
- Data Analysis Tasks (25 points)
- Benchmarking Tasks (40 points)
- Report structure
- Submission instructions
- Plagiarism policy
- References
Dataset
Important: This data folder contains 30 dataset folders with different dataset files. You should select only one dataset folder (one of the fxx where ) and use only one dataset folder. Make sure that your dataset folder contains five dataset files (friends.csv, messages.csv, events.csv, client_first_purchase_date.csv, campaigns.csv).
You can select the data folder by picking the dataset folder name in the sheet. Note that each dataset can be selected only once by one person.
Submission link to Moodle
Tools/Language to use
- Python
- PostgreSQL
- MongoDB
- Neo4J
Objectives
- Implement SQL and noSQL data models for an e-commerce company.
- Analyze the performance of SQL and noSQL databases.
Background
A global e-commerce company, faces challenges managing exponential data growth from customer transactions, product catalogs, social networks, and inventory systems. The company wants to find an efficient way to store and analyze the data. They want to see which data model they can use to have fast data retrieval and query processing.
Problem statement
The company is struggling with three big data issues:
- Volume: large amounts of data per day.
- Variety: Social network data, user behavior events, and campaign messages.
- Value: Analyzing customer social networks for targeted marketing.
The primary objective of this assignment is to design a big data solution to store petabytes (the provided dataset is only a snapshot) of raw data using effective, optimal and scalabe data models that can handle growth and complexity without compromising quality, efficiency, or usability. The optimal design will enable analytics and transactions for real-time and batch data processing. Your task is to find the best data model for storing the big data and obtaining valuable insights from it by following the tasks below.
Dataset Description
The given dataset consists of five csv files. The dataset has different snapshots and you need to select your snapshot of the dataset and work on it. The description of csv files are presented below.
client_id in client_first_purchase_date.csv and messages.csv is formulated by adding a unique identifier 151591562 as a prefix and user_device_id as a postfix to the user_id.
events.csv
This file contains behavior data for 3 months (from October 2019 to December 2019). Each row in the file represents an event. All events are related to products and users. Each event may happen multiple times between products and users, for instance, one product can be viewed by multiple users and one user can view multiple products. We can each line in the file as follows.
Given the following line of the file:
event_time,event_type,product_id,category_id,category_code,brand,price,user_id,user_session
2019-10-01 02:20:02 UTC,view,3701062,2053013565983425517,appliances.environment.vacuum,gorenje,90.07,550067820,b567743b-5fe0-4994-a3bd-949d5462e767
Or as a table.
| event_time | event_type | product_id | category_id | category_code | brand | price | user_id | user_session |
|---|---|---|---|---|---|---|---|---|
| 2019-10-01 02:20:02 UTC | view | 3701062 | 2053013565983425517 | appliances.environment.vacuum | gorenje | 90.07 | 550067820 | b567743b-5fe0-4994-a3bd-949d5462e767 |
We can read it as follows:
A user (*user_id=550067820*) during session (*user_session=b567743b-5fe0-4994-a3bd-949d5462e767*) viewed (property (*event_type*) is *view*) the product (*product_id=3701062*) of brand (*brand=gorenje*) of category (*category_id=2053013565983425517* and *category_code=appliances.environment.vacuum*) with price (*price=90.07*) at (*event_time=2019-10-01 02:20:02*)
campaigns.csv
This file contains information about marketing campaigns. Campaigns are messaging activities to a group of recipients. Channel is a kind of campaign like email, mobile push, web push and SMS. Campaign’s properties and metadata depends on the channel type. Emails
have subject, body (usually HTML with a lot of info, offers and personalization) and a lot of metrics like: click, spam complaint, hard bounce, unsubscribe. Mobile push and web push also have subject (first line of a message) and optional body (some browsers display it, some browsers don’t) and this channel don’t have some events like spam complaint, soft bounce or unsubscribe. SMS doesn’t have subject, only have body (text message) and has least number of events: deliver, click, purchase, hard bounce. Multichannel is a kind of transactional campaign when a retailer tries to deliver important information from the cheapest channel to the more expensive, depending on which channels recipient uses. For example the sequence can be like this:
- Try email
- If don’t have email, then mobile push
- If don’t have mobile push, then web push
- If don’t have web push, then SMS
There are 3 campaign types in dataset:
- Bulk campaign. These campaigns are usually sent to several segments (lists of recipients) grouped by some conditions. For example “visitors, who did’t receive any bulk campaign for the last 3 months” or any other business criteria.
- Trigger campaigns. It’s 1:1 messages which are sent as a reaction on user’s activity. The most famous example is abandoned cart: if user put something to a shopping card and didn’t make a purchase during 2 hours after the last add to cart event, trigger campaign abandoned cart tries to send a message through the channels recipient subscribed to.
- Transactional campaigns. Its informational messages like one-time password, email confirmation, bonuses added to your account, etc. It can be multichannel or any other channel like email, web push, etc. That’s why dataset has a lot of bulk campaigns and small number of other types,
The difference between bulk and two other types is that Bulk campaign can be sent once whereas triggers and transactionals works forever.
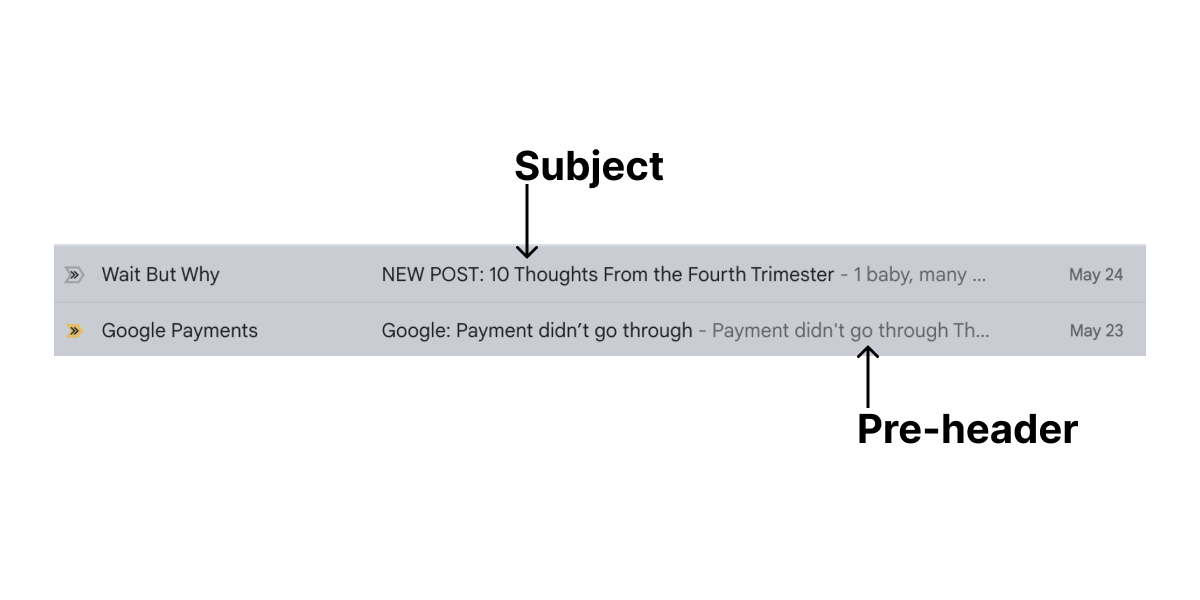
Subject is the title of a message. In email it’s the bold line of text in your inbox. In push campaigns it’s the main line of text in push notification. SMS doesn’t have subject. Pre-header is the preview text in your inbox. Usually it’s have no accent. And it works for email only. Topic is the meaning (main goal) of a bulk campaign.
Other properties of campaigns are:
subject_length- the lenght of subject in symbols (sometimes open rate depends on subject length)subject_with_personalization- subject includes personalization. Example: “Hello, John Wick, there is the special delivery for you!”subject_with_deadline- subject includes some kind of deadline. Example: “Hey, John Wick! Only 4 days left when you can get your special delivery!”subject_with_emoji- subject includes emoji. Example: “Hello, John Wick, there is the special delivery for you 😵🍺”subject_with_bonuses- subject includes information about bonuses. Example: “Hey, John Wick! We added 300 gold coins to your bonus account!”subject_with_discount- subject includes information about discount. Example: “Hey, John Wick! 40% discount in Continental for a low season!”subject_with_saleout- subject announces some kind of saleout. Example: “Hey, John Wick! Black Friday is coming!”
Only bulk campaigns have start date and finish date. Start date is the date/time in local timezone when a campaign was launched by marketing specialist. Finish date is the date/time when campaign did sent the final message.
Usually it takes from 30 minutes to 4 hours to send small to large campaigns. But some campaigns (warmup campaigns) can work days or weeks. Usually it’s done when retailer gets new recipients database and don’t want to be blocked by email providers due to high hard bounce or spam complaints rate (see Messages). In this case campaign has warmup_mode=True and hour_limit value which says how many messages can be sent every hour. The usual value of a hour limit is 500 or 1000. But sometimes when mailing domain is warmed up (got trust from email providers), limit can be increased to large values to finish the campaign. The column total_recipients says how many recipients was in bulk campaign when it was sent. Trigger and transactional campaigns don’t have this value.
Other service info including is_test - says it’s test campaign to a limited audience, and position - a position of trigger campaigns (only). Because different events can trigger different trigger campaigns, it’s important to prevent uncontrolled sending of trigger messages without limits (recipient will mark campaign as spam or unsubscribe from retailer). So there is an important sequence from most important triggers (less position is more important) to the less important (larger position number). If trigger with the smaller number can be sent, all other triggers are ignored. If can’t, next trigger is checked. If all triggers are checked and not match trigger conditions, trigger message is not sent.
An example line from campaigns.csv.
id,campaign_type,channel,topic,started_at,finished_at,total_count,ab_test,warmup_mode,hour_limit,subject_length,subject_with_personalization,subject_with_deadline,subject_with_emoji,subject_with_bonuses,subject_with_discount,subject_with_saleout,is_test,position
63,bulk,mobile_push,sale out,2021-04-30 07:22:36.615023,2021-04-30 07:23:41,48211,,False,,146.0,False,False,True,False,False,False,,
Or as a table:
| id | campaign_type | channel | topic | started_at | finished_at | total_count | ab_test | warmup_mode | hour_limit | subject_length | subject_with_personalization | subject_with_deadline | subject_with_emoji | subject_with_bonuses | subject_with_discount | subject_with_saleout | is_test | position |
|---|---|---|---|---|---|---|---|---|---|---|---|---|---|---|---|---|---|---|
| 63 | bulk | mobile_push | sale out | 2021-04-30 07:22:36.615023 | 2021-04-30 07:23:41 | 48211 | False | 146.0 | False | False | True | False | False | False |
The description of the columns in campaigns.csv file are described in the table below.
| Column title | Description | Example |
|---|---|---|
| id | Campaign ID | 64 |
| campaign_type | Campaign type (bulk, trigger, transactional) | bulk |
| channel | Channel (email, mobile_push, web_push, sms) | |
| topic | Meaning of a campaign | happy birthday |
| started_at | Bulk campaign start datetime | 2021-04-30 07:22:36.615023 |
| finished_at | Bulk campaign finish datetime | 2021-04-30 07:23:41 |
| total_count | Total recipients in bulk campaign | 48211 |
| ab_test | Bulk campaign with A/B test mode | false/true |
| warmup_mode | Bulk campaign with warmup mode | false/true |
| hour_limit | Hour limit for a bulk campaign with warmup mode | 300.00 |
| subject_length | Email subject length | 97.0 |
| subject_with_personalization | Subject contains recipient’s name | false/true |
| subject_with_deadline | Subject has deadline meaning (like “4 days left for…”) | false/true |
| subject_with_emoji | Subject has emoji symbols | false/true |
| subject_with_bonuses | Subject mentions bonuses for actions | false/true |
| subject_with_discount | Subject mentions a discount | false/true |
| subject_with_saleout | Subject mentions a sale out | false/true |
| is_test | It’s a test campaign (bulk campaigns only) | false/true |
| position | Priority of trigger campaigns | 4 |
messages.csv
Here the information about messages of campaigns are stored. All messages are related to some kind of campaigns:
- Bulk campaigns are sent for sale outs and before holidays to stimulate sales and bring back customers.
- Trigger messages (like abandoned cart) are sent automatically based on user’s behavior. More users visited website/app – more trigger messages are sent.
- Transactional messages are used for some kind of information delivery process: bonuses added, order delivery status changed, etc.
Note that campaign_id is unique only for a specific campaign_type, so two campaigns with different campaign_type can have the same campaign_id. Message row is an individual message sent to a single recipient. It contains type, channel, recipient and some attributess, described below.
-
Campaign related info:
campaign_id- identifier from campaigns dataframe.message_type- Message type (bulk, trigger, transactional).channel- Message channel. Keep in mind: there is no multichannel message type as it was in campaigns dataframe, becase campaign can be multichannel (can send messages to different channels), but message belongs to a single channel.
-
Recipient info:
client_id- recipients ID in REES46 database (unique per user).email_provider- a domain part of email (for email messages) like gmail.com or hotmail.com. Can be NA: data removed for unique personal or corporate domains with small number of messages which could cause person identification.
-
Device related info
platform- platform type where a message was opened (if it was opened). This is defined automatically according to user-agent or other service info. For example smartphone, tablet, phablet.stream- string value of a device type (desktop, ios, android, etc) where a message was opened (if it was opened). This is defined by app developer on retailer side, when they integrate SDK.
-
Behavior related info:
date- date in YYYY-MM-DD when a message was sent. It’s part of sent_at datetime property, helps to group messages by days.sent_at- Datetime when a message was sent.is_opened- Boolean flag if a message was opened by a recipient.opened_first_time_at- First time when a message was opened.opened_last_time_at- Last time when a message was opened (can be equal to opened_first_time_at, if the message was opened only once).is_clicked- Boolean flag if a message was clicked by a recipient.clicked_first_time_at- First time when a message was clicked.clicked_last_time_at- Last time when a message was clicked (can be equal to clicked_first_time_at, if the message was clicked only once).is_unsubscribed- Boolean flag if a recipient clicked unsubscribe link in a message.unsubscribed_at- Datetime when a recipient clicked unsubscribe link in a message.is_hard_bounced- Datetime when a message was “hard bounced”: permanent failure to deliver a message if recipient’s address does not exist (email is not exist or mobile push token is invalid).hard_bounced_at- Datetime when a message was hard bounced.is_soft_bounced- Datetime when a message was “soft bounced”: temporary failure to deliver a message if recipient’s address temporary can’t receive emails (for example mailbox is full, but exists and possibly can receive messages in the future).soft_bounced_at- Datetime when a message was soft bounced.is_complained- Boolean flag if a recipient clicked SPAM button in email client.complained_at- Datetime when a recipient clicked SPAM button in email client.is_blocked- Boolean flag if a delivery attempt was temporarily blocked by email provider (postmaster says "you act like spammer, I won’t deliver your email). It’s not permanent ban.blocked_at- Datetime when a delivery attempt was temporarily blocked by email provideris_purchased- Boolean flag if a recipient clicked any link in a message, opened a website or mobile app and made a purchasepurchased_at- Datetime when a recipient made a purchase after click on email or other message.
client_first_purchase_date.csv
This file contains the date of the first purchase for the client.
friends.csv
This file stores the mutual friendship between users. Both columns contain ids belong to the user_id in other files.
Data Modeling and Storage Tasks (35 points)
Important: The reference paper for the report of this assignment is here. Download the paper and read it before starting the assignment.
Important: Before you start solving the tasks, create a new repository on Github for this assignment and submit only the repository link to Moodle. You can add the TA (firas-jolha) as contributor if your repository is private. There is no specific structure for the repository but you should minimally have:
/scriptsfolder to store all types of scripts and queries. SQL queries should have.sqlextension, MongoDB queries should have.jsextension, and Neo4J queries should have.cypherextension./screenshotsfolder to store the screenshots./outputfolder to put the results of the experiments.report.pdfis your final report.
Hackolade is a data modeling tool for SQL and NoSQL databases, APIs, and storage formats. It is a graphical design tool for building data models. You can access the freemium Hackolade Studio on the browser and use it for building your data models. You can also download the software and run it on your machine using the links below. Use the community edition of the software.
- Windows 64
- Minimum requirement: Windows 10 or above
- MacOS Intel
- Minimum requirement: Mac OS X 10.11 (El Capitan) or higher
- MacOS ARM (M1/M2)
- Minimum requirement: Mac OS X 11 (Big Sur) or higher
- Linux
- Minimum requirement: Kernel v3.2 or above
- Download the dataset from the given link.
- Use Hackolade to build the data models below.
- Build a data model to store the data in PSQL database. Add the model to the report. Try to build an optimal data model. A random or incomplete model will not get any points.
- Build a data model to store the data in MongoDB database. Add the model to the report. Try to build an optimal data model. A random or incomplete model will not get any points.
- Build a data model to store the data in Neo4J database. Add the model to the report. Try to build an optimal data model. A random or incomplete model will not get any points.
- Do any data cleaning needed for the datasets and put the code in
scripts/clean_data.pyfile. - Implement the data model for PSQL database and load all data. Add the database creation and data loading instructions to a file
/scripts/load_data_psql.sqlin your repository. The script will be executed from the command line assudo psql -d ecommerce -f scripts/load_data_psql.sql(You can assume that there is an empty databaseecommercealready created). Do not worry about authentication issues. - Implement the data model for MongoDB database and load all data. Add the database creation and data loading instructions to a file
/scripts/load_data_mongodb.jsin your repository. The script will be executed from the command line assudo mongosh --file scripts/load_data_mongodb.js. Do not worry about authentication issues. - Implement the data model for Neo4J database and load all data. Add the database creation and data loading instructions to a file
/scripts/load_data_neo4j.cypherin your repository. The script will be executed from the command line assudo cat scripts/load_data_neo4j.cypher | cypher-shell. Do not worry about authentication issues. You do not create a new database here but use the default databaseneo4j. - Design and implement your own best scalable data model that may be better than all data models above. Discuss the advantages and disadvantages of your data model with respect to the pervious ones. Add the data model and the discussion to the report. Add the database creation and data loading instructions to the folder
/scripts.
Data Analysis Tasks (25 points)
- Build a Python program to analyze the stored data. The program should have access to the databases via Python clients/drivers. You can use psycopg2-binary for PSQL, pymongo for MongoDB, and neo4j for Neo4J. Put your Python scripts in the folder
/scripts. - For each of first three data modeling solutions, perform the following analysis below.
- Anlyze the data to find out whether campaigns attracted the customers to purchase products. The business aims to engage more customers in next campaigns by leveraging the social network info. Suggest your approach to achieve this goal supported by queries. Write the queries in scripts in files
/scripts/q1.sql,/scripts/q1.js,/scripts/q1.cypher. Add the analysis results to the report including the queries and your analysis approach. - The business has logged behavior of customers on the platform. Use this information to find out which top personalized recommended products we can display in the home page of the user. Write the queries in scripts in files
/scripts/q2.sql,/scripts/q2.js,/scripts/q2.cypher. Add the analysis results to the report including the queries and your analysis approach. - Based on the top products you obtained above, find out which products can be retrieved by full text search for products based on keywords from the
category_codeof the products. Add the analysis results to the report including the queries and your analysis approach. Write the queries in scripts in files/scripts/q3.sql,/scripts/q3.js,/scripts/q3.cypher.
Benchmarking Tasks (40 points)
- Add the specifications of your test machine (OS, RAM, CPU, CPU clock).
- Add the specifications of your software (PSQL version, Neo4J version, MongoDB version). Add the details of your setup like which software you used and whether you used virtualization and containerization (Docker or Virtualbox or …etc). If you used a virtual machine (VM), add the specifications of the VM.
- Make sure that you have built all databases and tested the database connection.
- Run all queries 5 times per database. Add screenshots for all results per database. You can use
timecommand here for Linux systems. - Build a table of the results and add it to the report.
- Calculate the average and standard deviation of the execution times per database and add it to the report. Organize all results in a table and draw a chart
query execution timessimilar tofig. 7in the referece paper.
For benchamarking, you can use hyperfine but do not forget to export the results in a specific format to add to the report.
Report structure
The report should have a similar sturucture to the reference paper. Ensure that you have minimaly the following sections:
- Abstract: provides a summary of your report
- Data Modeling: includes details related to data models you built for all databases
- Experimental Results: includes the analysis results and the queries with benchmarking results
- Discussion: A critical discussion and comparison of the analysis results and reflections on your findings
Submission instructions
- You need to submit only the link to your repository (public or private). Do not forget to add the TA (firas-jolha) if your repository is private.
- The repository should be organized.
- The repository should include all scripts and source code files in addition to the report as
.pdf(docx,docor any other formats are not accepted). - Repository documentation is not required but good to do it.
- The assignment is individual and the student should submit only their own original code and report.
- The link to Moodle submission is here.
Plagiarism policy
It is allowed to use any support tools but not recommended to us GenAI tools for generating text or code. You can use these generative tools to proofread your report or check the syntax of the code. All solutions must be submitted individually. We will perform a plagiarism check on the code and report and you will be penalized if your submission is found to be plagiarized.
References
- S. Uzunbayir, “Relational Database and NoSQL Inspections using MongoDB and Neo4j on a Big Data Application,” 2022 7th International Conference on Computer Science and Engineering (UBMK), Diyarbakir, Turkey, 2022, pp. 148-153, doi: 10.1109/UBMK55850.2022.9919589.
- Data modeling in MongoDB
- Data modeling in Neo4J
- Hackolade
- Dataset reference
- REES46 Marketing Platform